Demodulation, or detection, is the process of recovering a modulating signal from the modulated output voltage. The netlist below illustrates this process, using Star-Hspice behavioral models and FFT analysis to confirm the validity of the process in the frequency domain. The Laplace element is used in the low-pass filter. This filter introduces some delay in the output signal, which causes spectral leakage if no windowing is used in FFT. However, when window weighting is used to perform FFT, the spectral leakage is virtually eliminated. This can be verified from the THD of the two outputs shown in the output listing that follows. Since a 1 kHz output signal is expected, a frequency of 1 kHz is specified in the .FFT command. Additionally, specifying the desired FMAX provides the first few harmonics in the output listing for THD calculations.
Balanced Modulator & Demodulator Circuit
V1 mod1 GND sin(0 5 1K 0 0 0) $ modulating signal
r1 mod1 2 10k
r2 2 3 10k
r3 2 GND 10K
E1 3 GND OPAMP 2 GND $ buffered output of modulating signal
V2 mod2 GND sin(0 5 10K 0 0 0) $ modulated signal
E2 modout GND vol='(v(3)*v(mod2))/10.0' $ multiply to modulate
V3 8 GND sin(0 5 10K 0 0 0)
E3 demod GND vol='(v(modout)*v(8))/10.0' $ multiply to demodulate
* use a laplace element for filtering
E_filter lpout 0 laplace demod 0 67.11e6 / 66.64e6 6.258e3 1.0 $ filter out +the modulating signal
*
.tran 0.2u 4m
.fft v(mod1)
.fft v(mod2)
.fft v(modout)
.fft v(demod)
.fft v(lpout) freq=1.0k fmax=10k $ ask to see the first few harmonics
.fft v(lpout) window=harris freq=1.0k fmax=10k $ window should
+ reduce spectral leakage
.probe tran v(mod1) V(mod2) v(modout) v(demod) v(lpout)
.option acct post probe
.end
The relevant portion of the output listing is shown below to illustrate the effect of windowing in reducing spectral leakage and consequently, reducing the THD.
balanced modulator & demodulator circuit
****** fft analysis tnom= 25.000 temp= 25.000
******
fft components of transient response v(lpout)
Window: Rectangular
First Harmonic: 1.0000k
Start Freq: 1.0000k
Stop Freq: 10.0000k
dc component: mag(db)= -3.738D+01 mag= 1.353D-02 phase= 1.800D+02
frequency frequency fft_mag fft_mag fft_phase
index (hz) (db) (deg)
4 1.0000k 0. 1.0000 35.6762
8 2.0000k -26.6737 46.3781m 122.8647
12 3.0000k -31.4745 26.6856m 108.1100
16 4.0000k -34.4833 18.8728m 103.6867
20 5.0000k -36.6608 14.6880m 101.8227
24 6.0000k -38.3737 12.0591m 100.9676
28 7.0000k -39.7894 10.2455m 100.6167
32 8.0000k -40.9976 8.9150m 100.5559
36 9.0000k -42.0524 7.8955m 100.6783
40 10.0000k -42.9888 7.0886m 100.9240
total harmonic distortion = 6.2269 percent
******
balanced modulator & demodulator circuit
****** fft analysis tnom= 25.000 temp= 25.000
******
fft components of transient response v(lpout)
Window: Blackman-Harris
First Harmonic: 1.0000k
Start Freq: 1.0000k
Stop Freq: 10.0000k
dc component: mag(db)= -8.809D+01 mag= 3.938D-05 phase= 1.800D+02
frequency frequency fft_mag fft_mag fft_phase
index (hz) (db) (deg)
4 1.0000k 0. 1.0000 34.3715
8 2.0000k -66.5109 472.5569u -78.8512
12 3.0000k -97.5914 13.1956u -55.7167
16 4.0000k -107.8004 4.0736u -41.6389
20 5.0000k -117.9984 1.2592u -23.9325
24 6.0000k -125.0965 556.1309n 33.3195
28 7.0000k -123.6795 654.6722n 74.0461
32 8.0000k -122.4362 755.4258n 86.5049
36 9.0000k -122.0336 791.2570n 91.6976
40 10.0000k -122.0388 790.7840n 94.5380
total harmonic distortion = 47.2763m percent
*******
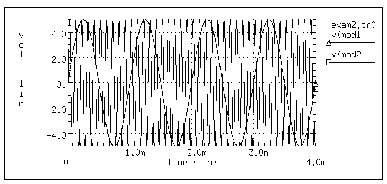
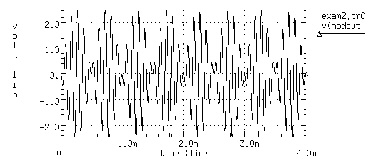
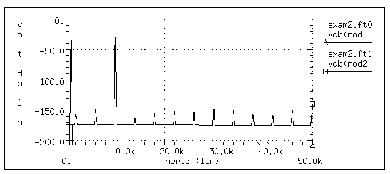
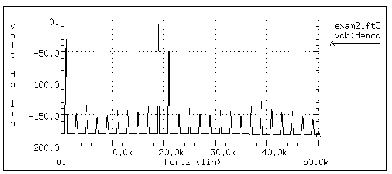
The signals and their spectral content are shown in Figures Modulating and Modulated Signals through Filtered Output Signal (Blackman-Harris window). The modulated signal contains only the sum and the difference of the carrier frequency and the modulating signal (1 kHz and 10 kHz). At the receiver end the carrier frequency is recovered in the demodulated signal, which also shows a 10 kHz frequency shift in the above signals (to 19 kHz and 21 kHz).
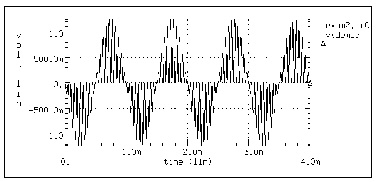
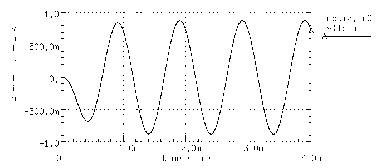
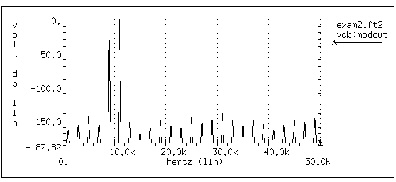
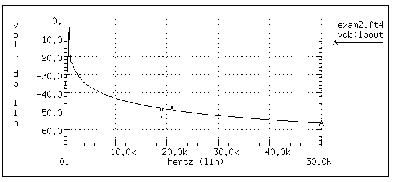
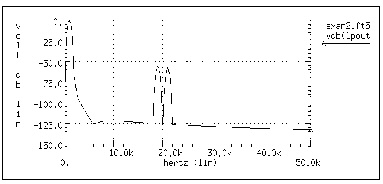
A low-pass filter is used to extract the carrier frequency using a second order Butterworth filter. Use of a Harris window significantly improves the noise floor in the filtered output spectrum and reduces THD in the output listing (from 9.23% to 0.047%). However, it appears that a filter with a steeper transition region and better delay characteristics is needed to suppress the modulating frequencies below the -60 dB level. The "Filtered Output Signal" waveform in Filtered Output Signal is normalized.