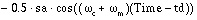
This example input listing on the following page shows a 1 kHz carrier (FC) that is modulated by a 100 Hz signal (FM). The voltage at node 1, which is an AM signal, can be described by
The preceding equation can be expanded as follows.
The preceding equations indicate that v(1) is a summation of three signals with frequency  ,
,  , and
, and -- namely, the carrier frequency and the two sidebands.
AM Modulation
.OPTION post
.PARAM sa=10 offset=1 fm=100 fc=1k td=1m
VX 1 0 AM(sa offset fm fc td)
Rx 1 0 1
.TRAN 0.01m 52m
.FFT V(1) START=10m STOP=40m FMIN=833 FMAX=1.16K
.END
The relevant portion of the listing file is shown below.
*********
am modulation
****** fft analysis tnom= 25.000 temp= 25.000
******
fft components of transient response v(1)
Window: Rectangular
Start Freq: 833.3333
Stop Freq: 1.1667k
dc component: mag(db)= -1.480D+02 mag= 3.964D-08 phase= 0.000D+00
frequency frequency fft_mag fft_mag fft_phase
index (hz) (db) (deg)
25 833.3333 -129.4536 336.7584n -113.0047
26 866.6667 -143.7912 64.6308n 45.6195
27 900.0000 -6.0206 500.0008m 35.9963
28 933.3333 -125.4909 531.4428n 112.6012
29 966.6667 -142.7650 72.7360n -32.3152
30 1.0000k 0. 1.0000 -90.0050
31 1.0333k -132.4062 239.7125n -9.0718
32 1.0667k -152.0156 25.0738n 3.4251
33 1.1000k -6.0206 499.9989m 143.9933
34 1.1333k -147.0134 44.5997n -3.0046
35 1.1667k -147.7864 40.8021n -4.7543
***** job concluded
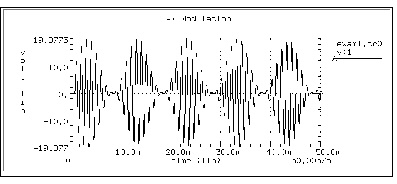
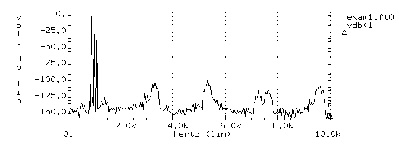
Figures AM Modulation and AM Modulation Spectrum display the results. AM Modulation shows the time domain curve of node 1. AM Modulation Spectrum shows the frequency domain components of the magnitude of node 1. Note the carrier frequency at 1 kHz, with two sideband frequencies 100 Hz apart. The third, fifth, and seventh harmonics are more than 100 dB below the fundamental, indicating excellent numerical accuracy. Since the time domain data contains an integer multiple of the period, no windowing is needed.