This section describes how to determine typical data sheet parameters.
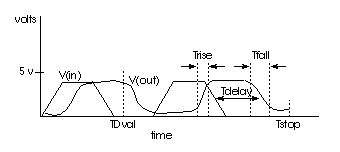
The following example first calculates vmax, using the MAX function over the time region of interest. Then it calculates vmin using the MIN function. Finally, the measured parameters can be used in subsequent calculations for accurate 10% and 90% points in the determination of the rise and fall time. Note that the RISE=1 is relative to the time window formed by the delay TDval. Finally, the delay Tdelay is calculated using a fixed value for the measure threshold.
.MEAS TRAN vmax MAX V(out) FROM=TDval TO=Tstop
.MEAS TRAN vmin MIN V(out) FROM=TDval TO=Tstop
.MEAS TRAN Trise TRIG V(out) val='vmin+0.1*vmax' TD=TDval
+ RISE=1 TARG V(out) val='0.9*vmax' RISE=1
.MEAS TRAN Tfall TRIG V(out) val='0.9*vmax' TD=TDval
+ FALL=2 TARG V(out) val='vmin+0.1*vmax' FALL=2
.MEAS TRAN Tdelay TRIG V(in) val=2.5 TD=TDval FALL=1
+ TARG V(out) val=2.5 FALL=2
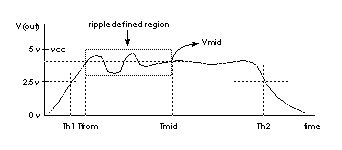
This example performs the following:
.MEAS TRAN Th1 WHEN V(out)='0.5*vcc' CROSS=1
.MEAS TRAN Th2 WHEN V(out)='0.5*vcc' CROSS=2
.MEAS TRAN Tmid PARAM='(Th1+Th2)/2'
.MEAS TRAN Vmid FIND V(out) AT='Tmid'
.MEAS TRAN Tfrom WHEN V(out)='Vmid' RISE=1
.MEAS TRAN Ripple PP V(out) FROM='Tfrom' TO='Tmid'
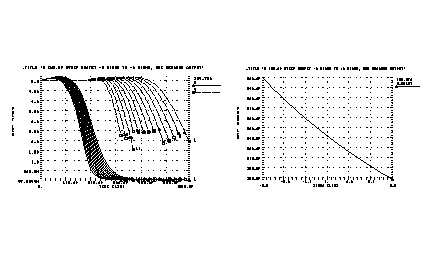
This file is set up to sweep sigma of the model parameter distribution while looking at the delay, giving the designer the delay derating curve for the model worst cases. This example is based on the demonstration file in $installdir/demo/hspice/cchar/ sigma.sp. This technique of building a worst case sigma library is described in Performing Worst Case Analysis.
.tran 20p 1.0n sweep sigma -3 3 .5
.meas m_delay trig v(2) val=vref fall=1 targ v(4) val=vref
+ fall=1
.param xlnew ='polycd-sigma*0.06u' toxnew='tox-sigma*10'
.model nch nmos LEVEL=28 xl = xlnew tox=toxnew
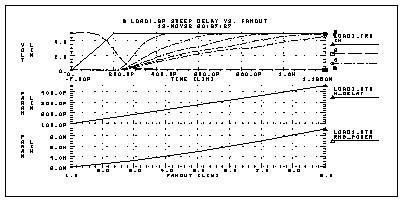
This example sweeps the subcircuit multiplier to quickly generate a family of five load curves. You can obtain more accurate results, by buffering the input source with one stage. The following example calculates the mean, variance, sigma, and average deviance for each of the second sweep variables (m_delay and rms_power). This example is based on the demonstration file $installdir/ demo/hspice/cchar/load1.sp .
tran 100p 2.0n sweep fanout 1 10 2
.meas m_delay trig v(2) val=vref fall=1
mean = 273.8560p varian = 1.968e-20
sigma = 140.2711p avgdev = 106.5685p
mean = 5.2544m varian = 8.7044u
sigma = 2.9503m avgdev = 2.2945m
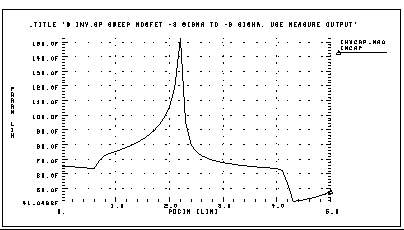
This example shows the effect of dynamic capacitance at the switch point. It sweeps the DC input voltage (pdcin) to the inverter and performs an AC analysis each 0.1 volt. The measure parameter incap is calculated from the imaginary current through the voltage source at the 10 kilohertz point in the AC curve (not shown). The peak capacitance at the switch point occurs when the voltage at the output side is changing in the opposite direction from the input side of the Miller capacitor, adding the Miller capacitance times the inverter gain to the total effective capacitance.
.ac lin 2 10k 100k sweep pdcin 0 5 .1
.measure ac incap find par( '-1 * ii(vin)/
+ (hertz*twopi)' ) AT=10000hertz
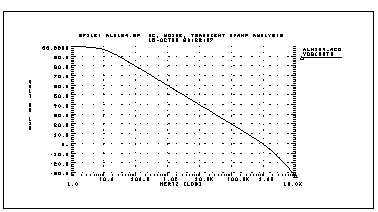
This example analyzes op-amps with .MEASURE statements to present a very complete data sheet. It references op-amp circuit output node out0 in the four .MEASURE statements using output variable operators for decibels vdb(out0), voltage magnitude vm(out0), and phase vp(out0). The example is taken from the demonstration file demo/apps/alm124.sp.
.measure ac 'unitfreq' trig at=1 targ vdb(out0) val=0 fall=1
.measure ac 'phasemargin' find vp(out0) when vdb(out0)=0
.measure ac 'gain(db)' max vdb(out0)
.measure ac 'gain(mag)' max vm(out0)
unitfreq = 9.0786E+05 targ= 9.0786E+05 trig= 1.0000E+00
gain(db) = 9.9663E+01 at= 1.0000E+00 from= 1.0000E+00
+ to= 1.0000E+07
gain(mag)= 9.6192E+04 at= 1.0000E+00 from= 1.0000E+00
+ to= 1.0000E+07